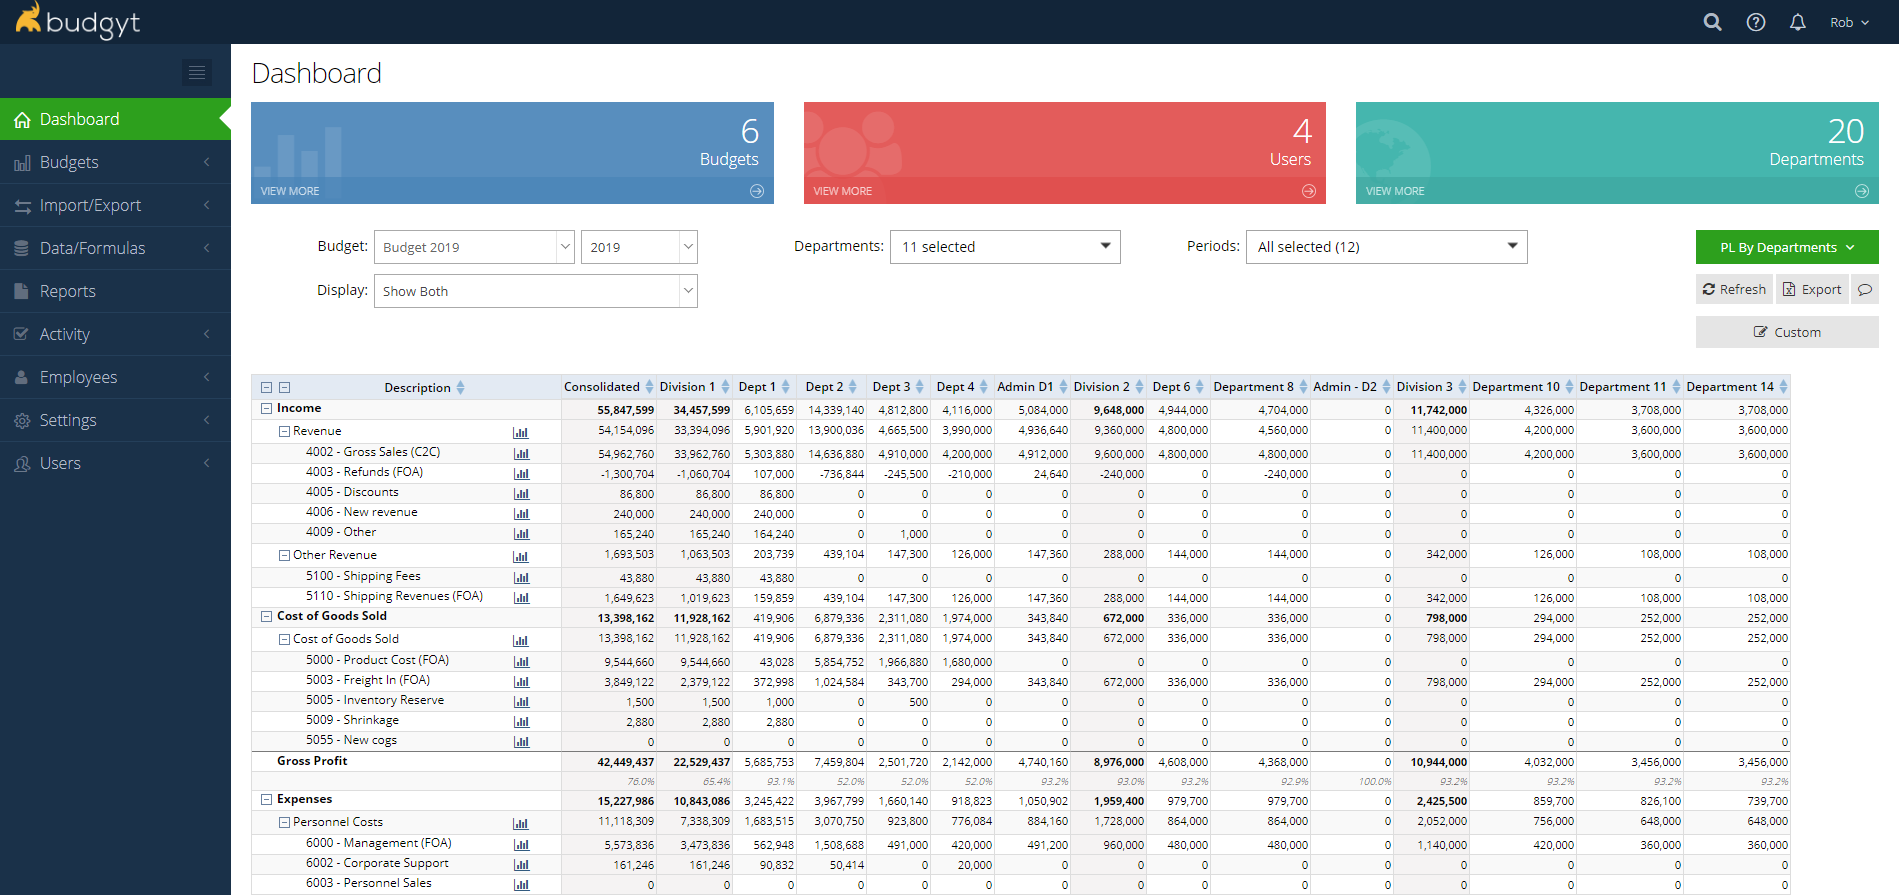
The first screen you see when you enter Budgyt is the Dashboard. This gives you a summarized view of your default budget, and allows you to look at all your budgets from different perspectives.
After making a selection from any of the menus noted below, you must click the Refresh button at the right to view your selection.
Viewing different budgets
All of the budgets that you have created can be found in the Budget dropdown at the top left, and you can also select a year for any particular budget in the year dropdown.
Consolidated Views
Just below the Budget dropdown in th PL by Departments view is the Display menu. This allows you to view each budget by just the consolidated totals (Entity or Division) or the individual Departments, or all three levels.
Viewing varying selections of Departments
In the center, there is a dropdown that allows you to select any or all of your departments.
Viewing by period.
To the right of this you may select to view any or all periods.
Overall View change.
The green button to the far right allows several different views to be selected
- PL by Departments shows your chart of accounts on the left, and the Departments across the top.
- PL by Period keeps your Chart of Accounts on the left, but shows your periods across the top. The view defaults to 12 months, but you can add in the quarterly totals, and select more periods from the Period menu.
- PL by Category will flip the display so you can see your Departments as rows, and your chart of accounts as columns.
- Budget Comp - To Date gives you the option to view 3 budgets (or actuals) next to each other, and shows the variance between Budget 1 and 2 and between Budget 1 and 3.
- Budget Comp - Monthly shows the same comparisons as the To Date option, but you'll see all 12 months on the same screen.