The Data Sheet is where you can control all the numbers in your budget. All data entry occurs on the data sheet.
The Data sheet allows you to see Group, Category, or Sub-Category level data across one or more of your departments. This page has many features that are very powerful and would take days and hours to recreate in Excel.
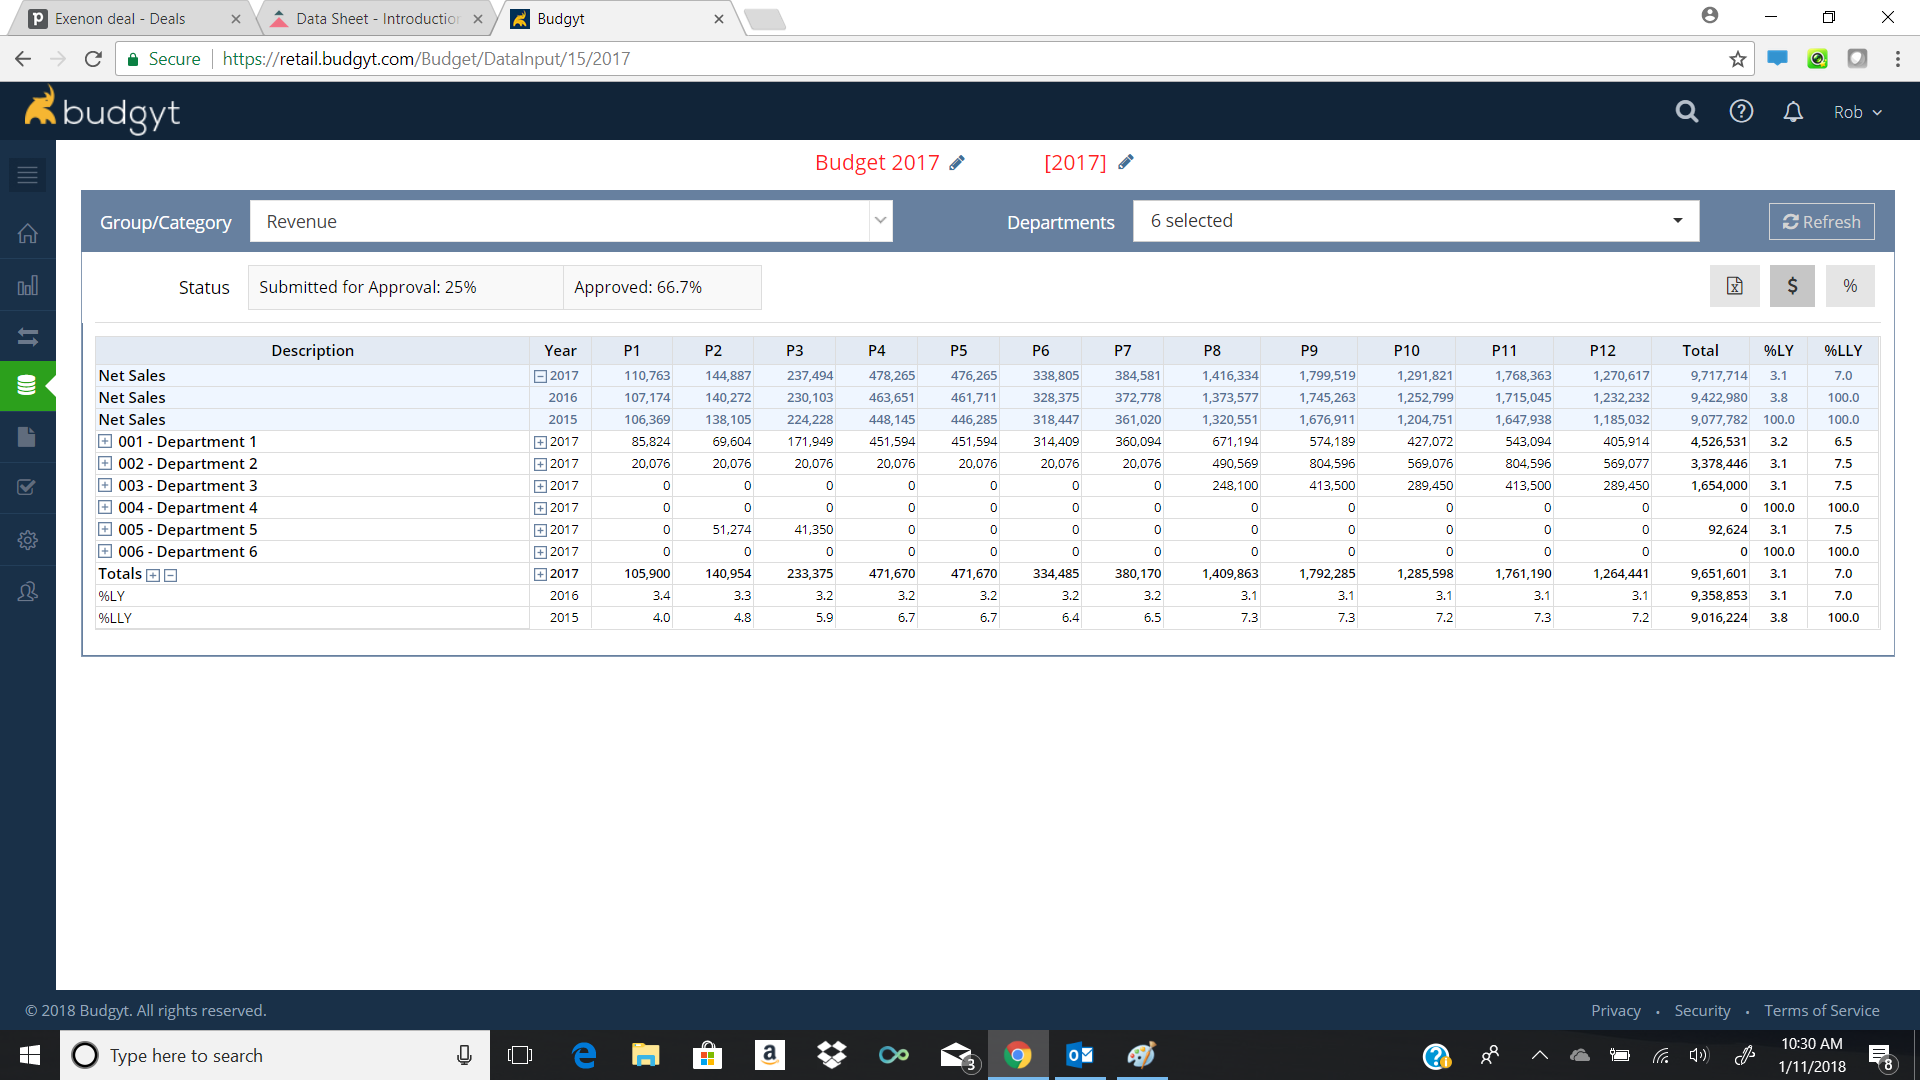
- Scenarios - at the top of the page we see the Scenario and Year in Red Font with a pencil icon next to each. You can switch between any active budget or year here.
- Groups/Categories - At the top left we have the Group/Category drop down menu where all categories and groups are organized by the COA hierarchy set in Budgyt. Non-Financial categories are also included in this list. Selecting a Category or Group (name in bold) will display that category or group of categories.
- Departments - the drop down at the top right allows you to choose which of your departments you wish to display.
- Refresh - hit the refresh button (top right) after changing the Department drop down to populate the data sheet with the new information.
- Excel (top right) - the excel icon allows you to export data sheet information to Excel for further analysis. The export contains the Code for the categories exported and can be a useful shortcut to help import data. To learn more about importing data click here.
- $/% buttons (top right) - by default the data sheet shows information in $, clicking the % button converts all data to a percentage of net sales of the department to which that data belongs. The $ button returns the data to $.
- Editing - to learn how to enter data in the data sheet page click here