To input and change data at the monthly level, you need to go to the Data Sheet page. This can be done in 2 ways:
- Go to Data/Formulas > Data Sheet, and then choose your GL Account, Budget, Year, and Department from the menus at the top of the screen.
- Whilst on the Dashboard page, click on the category or data point that you wish to edit - all category names and numbers on the Dashboard are hyperlinks. This will open the Data Sheet screen showing the category and department that you clicked on.
If you clicked on the name of a category/account on the dashboard, you'll see a list of departments as rows on the left of the screen. To access the detail within a department, either choose the department from the menu at the top right, or expand it by clicking the plus sign to the left.
Now you need to select the pencil icon (our edit tool) to the right of the category name that you are looking at, and you will see that a number of the fields on the page are given a yellow background. All of these are editable.
Each field may be edited manually, or you may use some of the short cuts listed below:
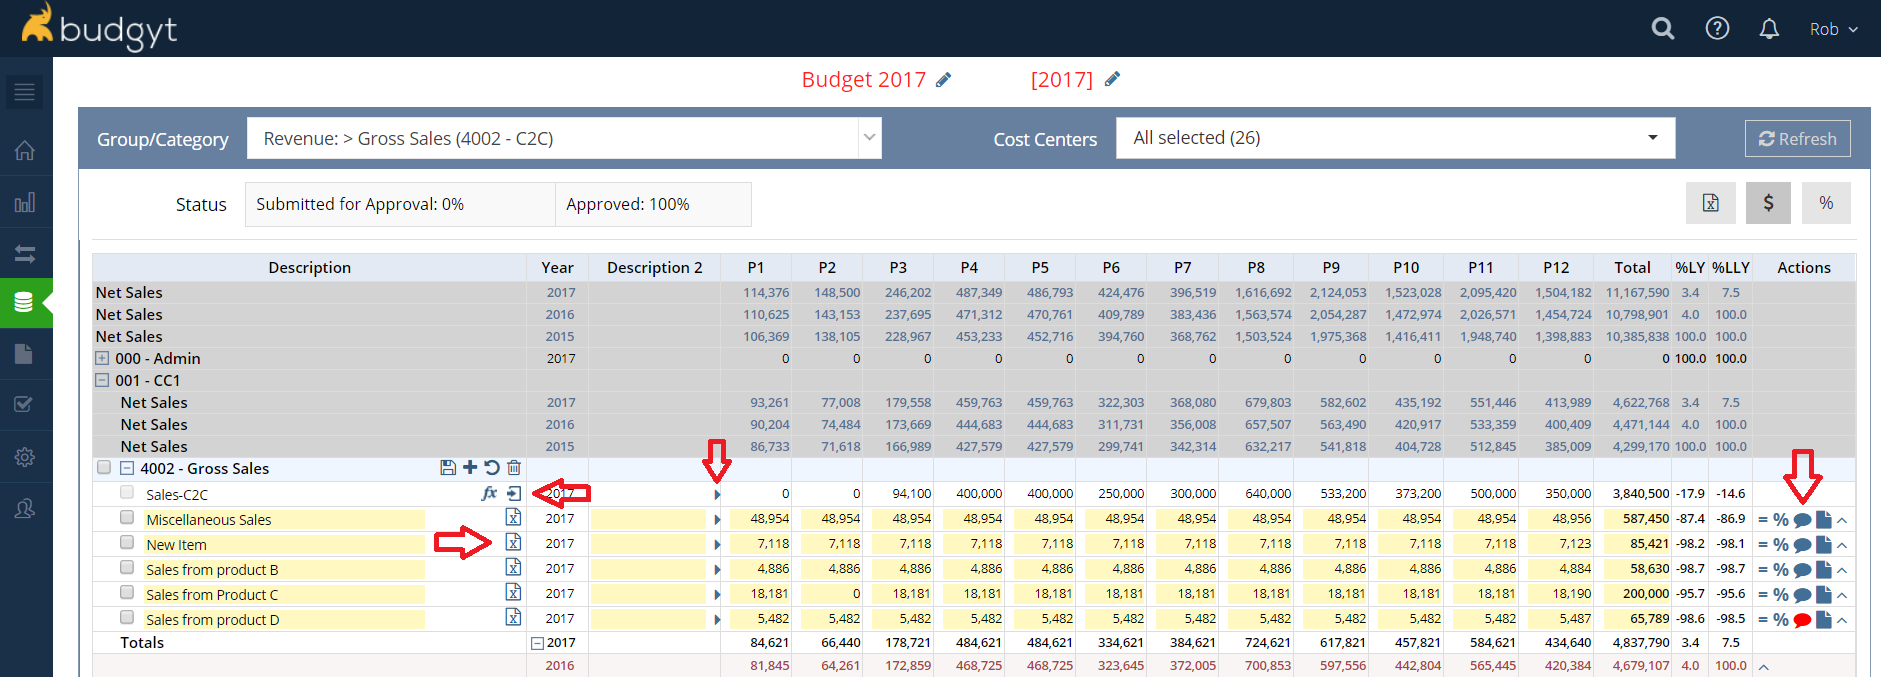
- Auto Fill all periods. The arrow to the left of the Period 1 column will take the value for period 1 and copy it to every other period.
- Built-in Calculator. Every cell in a period has a built in calculator that is accessed if you type = on the keyboard. Whatever calculation you make on the pop up calculator will appear in the cell when you hit enter, or click Use on the calculator.
- Excel Linking. The excel icon at the left lets you link the category to a row in an excel sheet. This excel file will be stored on this sub category line within Budgyt so that you may access it from wherever you are working. To learn more, click here.
- Spread Evenly. The = symbol in the Actions column at the right of the category line will take the value in the Total column, divide it by 12, and fill every period with that number.
- Copy Seasonality. If you change the total for the year, the % symbol will spread that total across the 12 periods according to the same seasonality that was shown previously. For example, if you had 100 in each period and in period 12 you had 200 as a value then your total is 11x100 plus 1x200 = 1,300. Now if you enter 2600 in the total cell and click the % action option the cells for Period 1 thru 11 will display 200 and the cell in period 12 will be 400. The % takes the value of each period as a percent to the original total and then multiplies each period % by the new total entered.
- Percentage Growth. The ^ symbol to the right of each sub category row allows you to grow that sub-category by a percentage across the whole year (enter the percentage as a decimal, +ve or -ve). This tool is also available on the two previous years' data below the total for the current year at the bottom of the grid. In this case it will allow you to copy data from those previous years with a growth rate. This will overwrite any sub category data that is present in the current year, so is usually used to give a starting point for the budget.
- Notes. Clicking the Note Pad icon under the Action allows comments to be added - it will turn red when there is note present. Notes will appear as footnotes on P+L Excel reports.
- Attachments. The Document icon allows you to attach any documents (in Word, PDF, or Excel format) that might assist in your users' understanding of the category. Again, this will turn red if a file is attached.
- Creating and Deleting Sub-Category lines. The + symbol to the right of the category name will add a blank Sub-Category row. If you wish to delete a row, check the box to the left of that row, and select the trash can icon on the category row.
- Comments - the Speech Bubble next to the edit tool turns on comment mode, which allows you to leave notes on each sub category row for each month. Just click on the data on which you wish to leave a comment. These comments may be directed to other users if required. Learn more about comments here.
- Sort by Description 1 or Description 2 using the Up/Down blue arrows you can sort the sub-categories by either of the Description fields. This is not available in Edit Mode.
- Save. The Floppy Disk icon will save your changes and remove the yellow edit backgrounds from the data sheet.
- Delete. The Trashcan icon will delete any sub-category whose check box was selected.
- Formulas. If there is a formula related to the category, you'll see an fx symbol in the category field. Clicking here will take you to the formula edit page.
- Direct editing of formula inputs. Next to the fx symbol there is an input symbol. Clicking on this will show all the inputs to the formula. If you click the pencil icon, then click on this input icon, you will be able to edit the inputs to the formula directly in the pop up window.
If you're not able to see the edit tool, this video may help explain why: